Report Designer
The Report Designer opens in its own window, with two data sources to start with, called Part and Sys. The Part data source is used to pick various text, numeric and image fields from the part to insert into the report. The Sys data source is used to place other elements in the report like standard logos, geometric shapes, divider lines or other images.
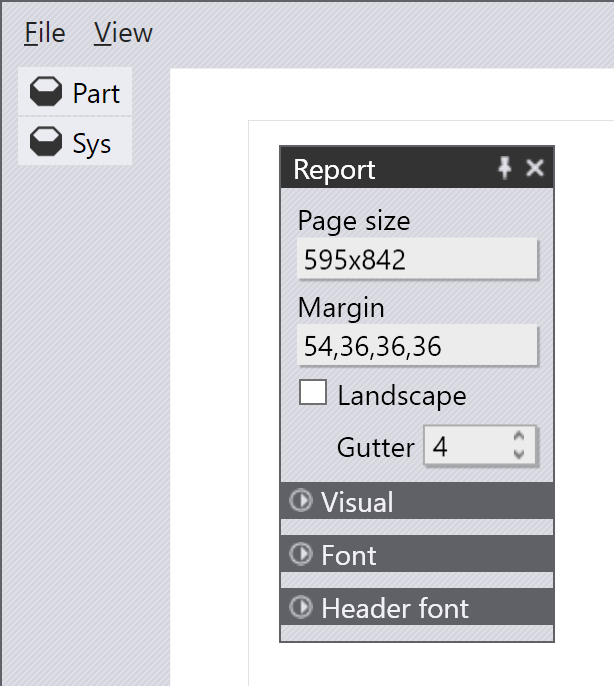
At this point, you can click on the empty page in the report to adjust the paper size, the orientation and the margins for the report. All sizes used in the report editor are in points.[1]. The Gutter you see in the image above is the standard gap that Flux places between fields in a report.[2].
You can use the data sources to:
-
Add Fields, Pictures and Tables to a report
-
Create Bands or sub-reports
-
Add static Labels, Bitmaps and Shapes