Bands (sub-reports)
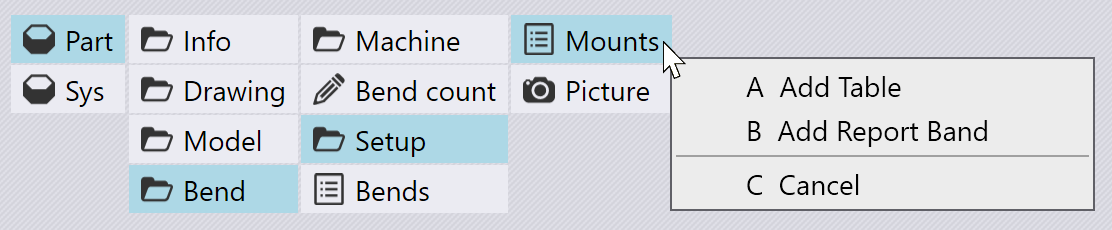
A table is useful for some types of repeated data. However, sometimes, we may need to display not just some text or numeric values in columns but may need a more elaborate display for each element in the table (for example, we may need a picture, or even a sub-table). For such situations, it is more useful to create a Band (this is sometimes called a sub-report). When you click on some data source that could be represented as either a table, or as a band, Flux will ask you if you want to insert a Band or a Table:
[Ask Band](img/askband.png)
If you choose to insert a Band, an empty band is inserted (the shaded area shown below), and the set of all the possible fields, pictures and tables that could be added to the band are shown on the right.
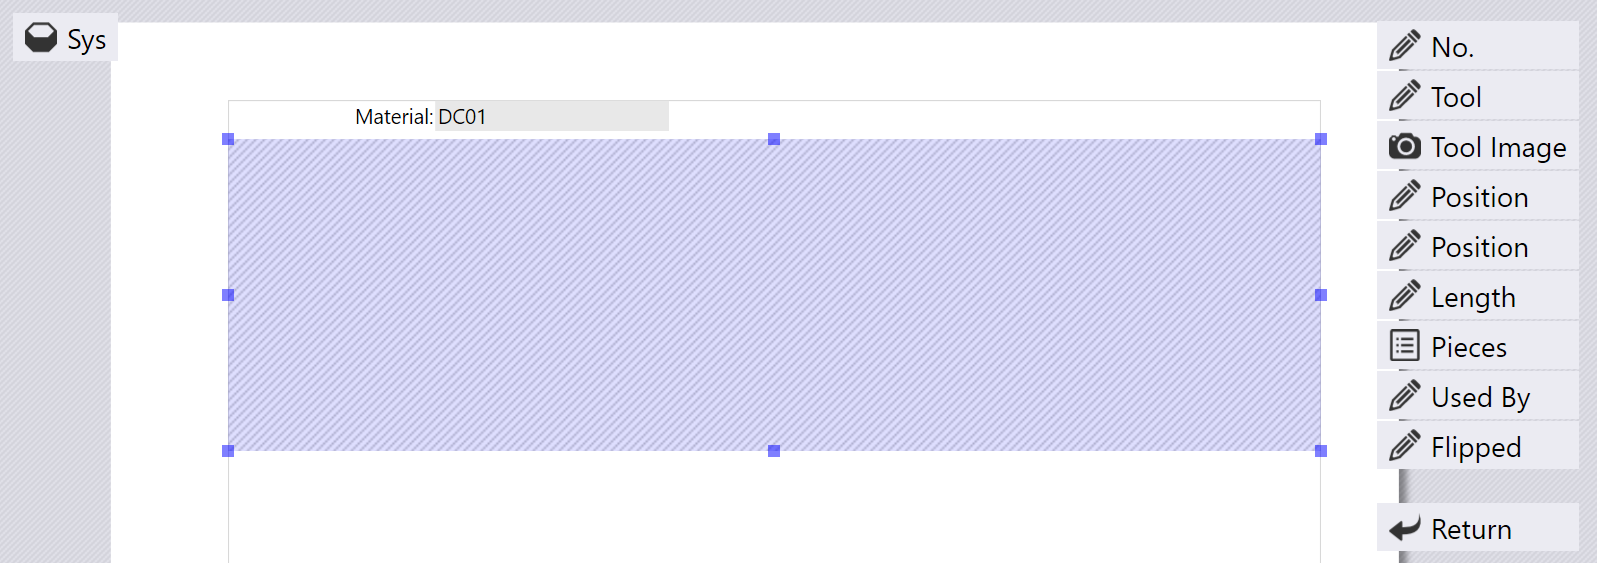
You can now compose the data in the band by adding the fields, tables, and pictures from the right. In addition to these, you can also add labels, static bitmaps or shapes (like divider lines) by picking from the Sys data source. In this example, we have created a band for the Part > Bend > Setup > Mounts data, so each band is going to display fields, images and tables related to one bend mount. After adding some elements into the band, the band may finally look like this:
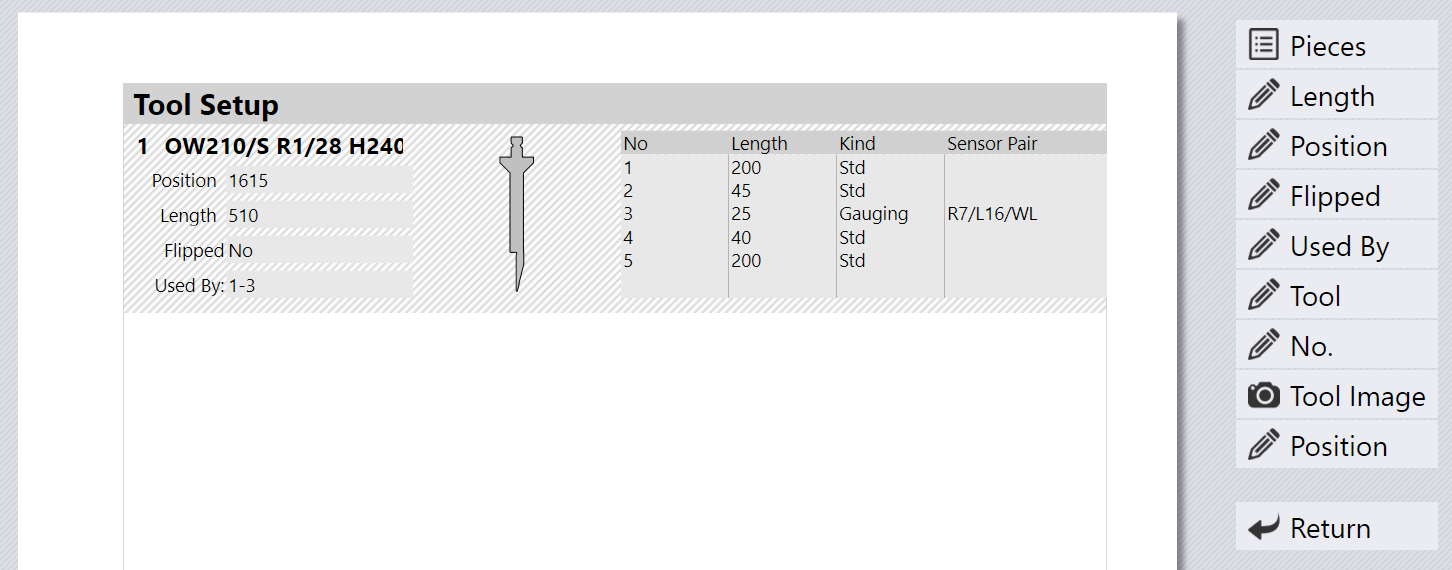
We composed this band by picking some fields (position, length, flipped etc). We also added the Name field at the top and changed it to use a larger font. Then, we added a picture (the tool cross-section) and a table (the set of segments in this mount). As we add these elements, the band displays live data for all of these, but only for the first mount in the setup.
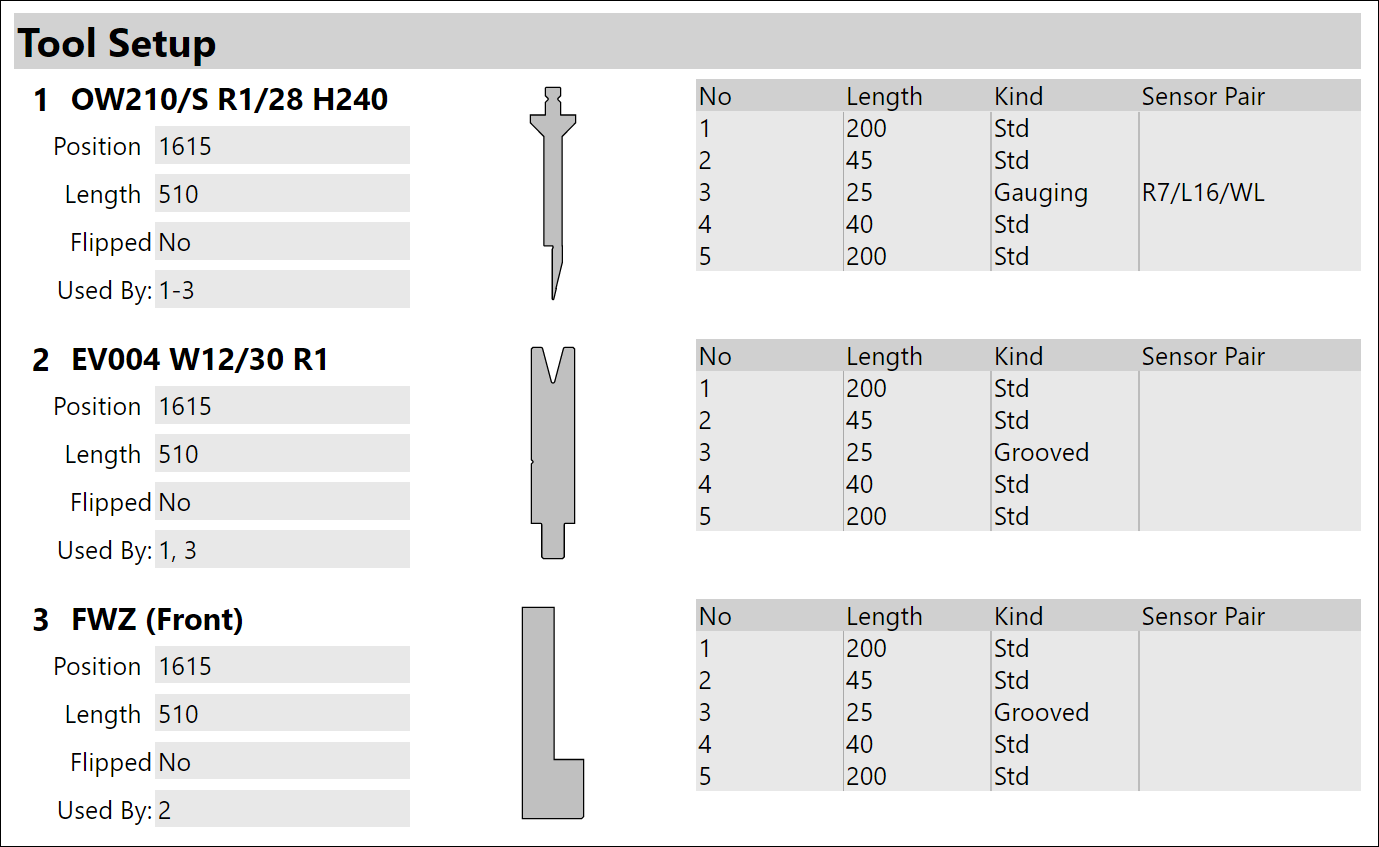
Later, when the report is actually printed, the entire band (with fields, pictures and tables) is repeated for each mount in the report. Here is a rendered example: